Venn Diagram. EVCA Toolbox IFRC (0)

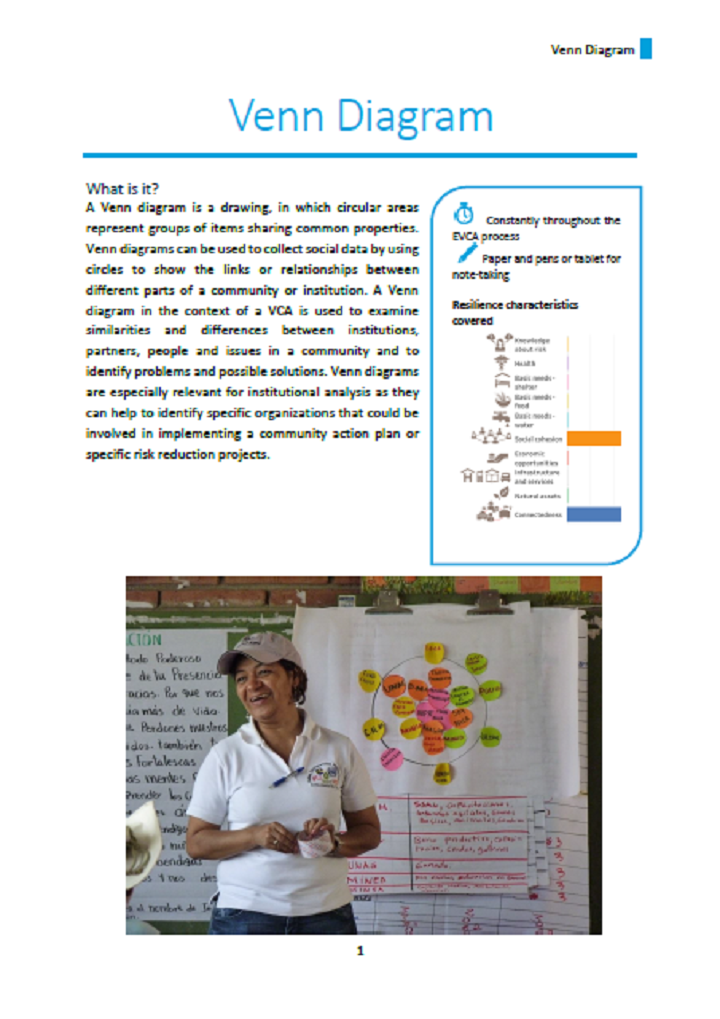
A Venn diagram is a drawing, in which circular areas represent groups of items sharing common properties. Venn diagrams can be used to collect social data by using circles to show the links or relationships between different parts of a community or institution. A Venn diagram in the context of a VCA is used to examine similarities and differences between institutions, partners, people and issues in a community and to identify problems and possible solutions. Venn diagrams are especially relevant for institutional analysis as they can help to identify specific organizations that could be involved in implementing a community action plan or specific risk reduction projects.

Bibliographic information

IFRC (0). Venn Diagram. EVCA Toolbox IFRC

Filter / Tags

Guidelines and manualsEnglish

Related Countries

Downloads

Venn Diagram. EVCA Toolbox


Type: application/pdf
Size: 0.66 MB

Download

Venn Diagram. EVCA Toolbox

Published in: 0
Pages: 5

Publisher:
IFRC

Author(s):
IFRC

Uploaded by:

Stay in Touch Get the Newsletter !

Stay informed about the activities of SuSanA and its partners. The SuSanA newsletter is sent out around four times per year. It contains information about news, events, new partners, projects, discussions and publications of the SuSanA network.

Subscribe

Are we allowed to crumble with cookies and anonymous tracking?

We use cookies on our website. Some of them are essential for the operation of the site (so called session cookies), while others help us to improve this site and the user experience (tracking cookies). We use the application Matomo and the external service etracker to analyze your behavior on our website anonymously. Because we value your privacy, we are here with asking your permission to use the following technologies. You can change your settings any time via this link or the menu item in footer menu. For more information visit our Data Policy